Introduction
Google has introduced the most notable change to Google Analytics ever: Google analytics 4. The digital marketing world has responded with excitement and caution after the announcement of GA4 and the discontinuation of Universal analytics. There is a lot to learn with significant updates, and it’s normal to wonder how this can impact your job or business. While we have not gotten any indication that conventional GA will be going anywhere in the near future, the latest attributes now default to Google Analytics 4. It is a hefty sign that learning Google analytics 4 is worth prioritizing. GA4 promises a lot of more intriguing latest features and updates than those that are found in UA; the reporting dashboard and reports have basically altered.
GA 4 enables lesser predefined reports and a greater ability to create your reports based on your particular requirements. The face of professional seo services has entirely changed.
The reporting interface is very distinct in Google Analytics 4 compared to universal analytics, so it is crucial to know where to look for your data.GA4 breaks the reports down into two main sections: Lifecycle and User reports and analytics.It may not be suddenly obvious where the corresponding reports you’re familiar with in Universal Analytics are. This guide will provide you a deep understanding about what is google analytics 4.Want to Boost Your Website’s Traffic and Increase Revenue?Get a custom strategy, world-class technology, and an elite SEO team for your project. Let’s Discuss
What Has Changed?
Google Analytics 4 utilizes mostly a distinct data structure and data collection logic. The latest GA 4 analytics version is built around users and events instead of sessions, as we have been accustomed to. An event-based version processes each user interaction as a full-fledged event. This switch is important because, since the beginning, we depended on a session-based model which grouped user interactions within a given time frame. Shifting focus from sessions to events offers major advantages to marketers, such as cross-platform analysis and an improved capacity for pathing analysis. By switching to an event-based model, Google Analytics 4 is more flexible and can predict user behavior well.
Read More About: Ultimate Guide to Stop Referral Spam in Google Analytics
Types of GA4 Reports
The navigation to the reports in Universal Analytics is generally through the reports menu pinned on the left-hand side. In Google analytics 4, it’s done through the overview segment followed by one click into a particular report gimmick. Once you get accustomed to the new navigation type, it will make GA4 a lot easier.
User Reports
The user reports in Universal Analytics tell us about the traits of website visitors, where they are located currently, what devices they operate, and their demographics. If you are finding such data in GA 4 analytics, you will find it in different locations.
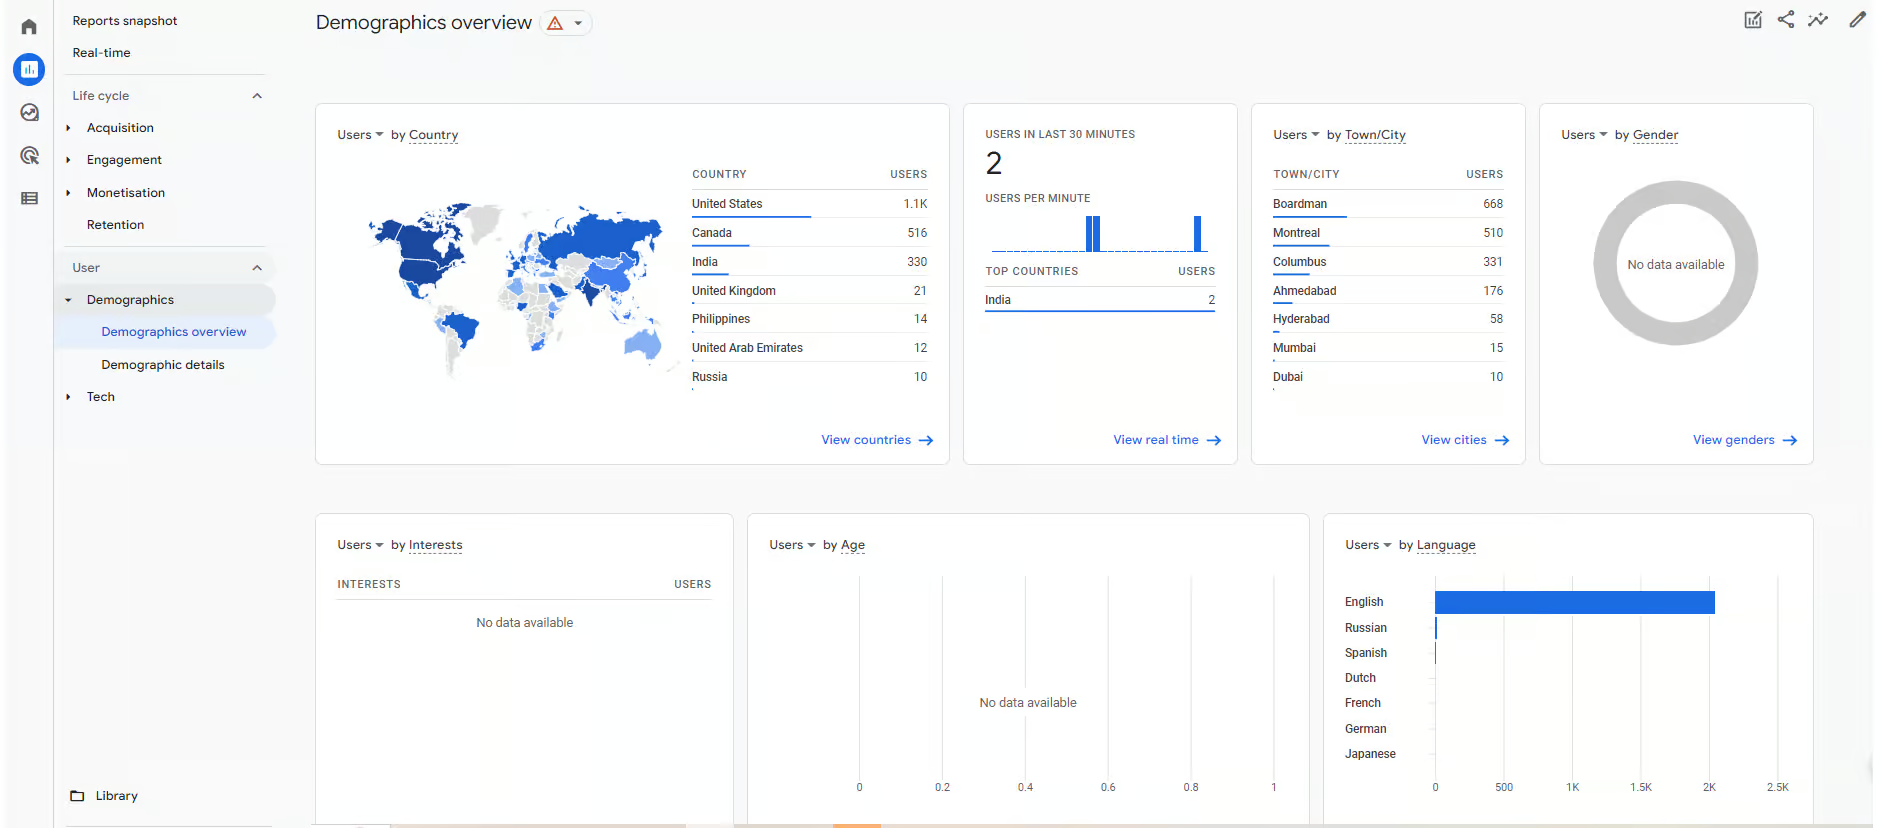
Fig 1 Countries Report in Demographics Overview
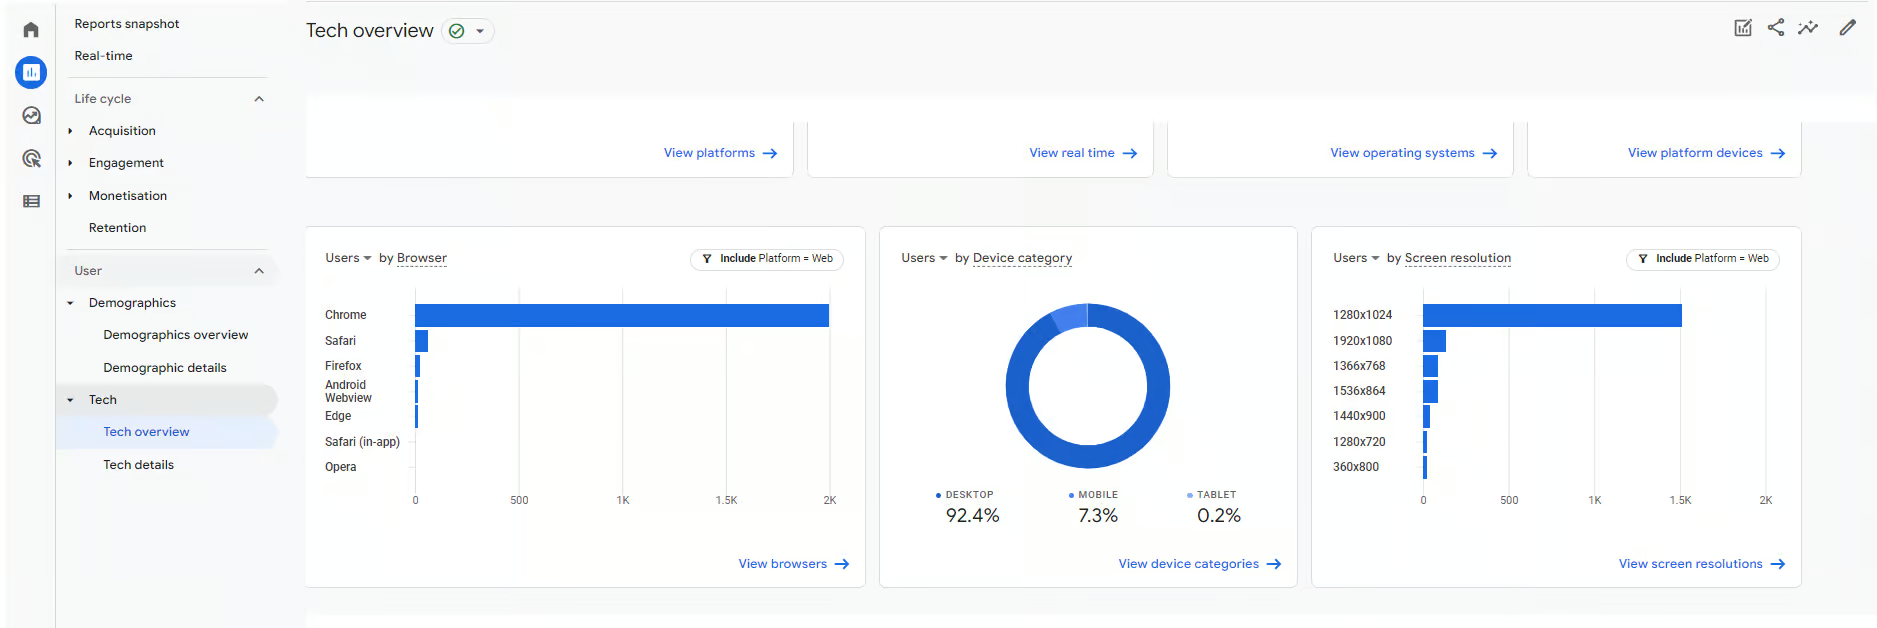
Fig 2 Devices Report in Tech Overview
Acquisition Reports
As digital marketers, we spend so much timein digital marketing reporting and analyzing traffic to a site and what channel and campaigns it brought from: this is how we report on performance.
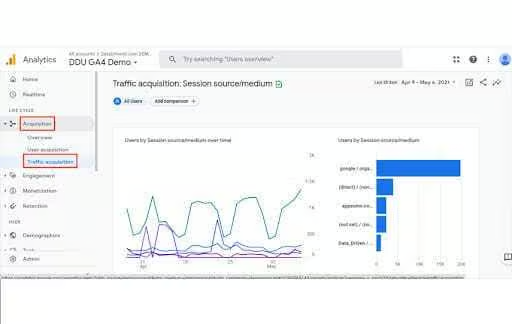
Source: datadriven Google Analytics 4 also shows how people basically find the site with new reports like User Acquisition and User acquisition: First User Medium.
The first user medium is mostly for campaign traffic and represents traffic mediums, such as email and CPC organic search to help people find the site. These new reports and analytics are handy for representing the effect of top of funnel activity that brings prospective customers onto your website to begin their initial browsing.Universal Analytics didn’t represent this data, as it was mapping site traffic or sessions, it would show users in totals but not how they visited the website for the first time.There are some first user touch point data in multi-channel funnels reports in Universal Analytics; the G4 Analytics first user acquisition reports are more potent and useful for showing you the channels that make the user familiar with your website.
Behavior Reports
The behavior reports in Universal Analytics permitted users to look at the site content to view what pages people are visiting. Google Analytics 4 combines website pages and app screens into one reporting and analytics area known as “Pages and Screens,” which can be seen in the Engagement section of GA4. You can also report on all page communication events in the engagement section to view what interactions people are having with your website to aid you in understanding your conversions and customer journey well.Although, we can include a secondary dimension to user acquisition reports to swiftly see our top landing pages for a few visitors to the site.
Conversion Reports
One of its most extraordinary features was tracing the valuable actions people conduct on websites, like making a purchase or filling out a lead form. These extraordinary actions are known as goals in Universal Analytics, and the same thing is known as conversions in Google Analytics 4.The Universal Analytics data is the handiest when it is considered in terms of channels, devices, and locations. These elements drive these goals; there is an overview segment where we can see our totals over time to assist us in spotting trends.
Source: analyticsboosters
Tracking goals in GA4 relies on events that are produced automatically by the GA 4 system. However, you can generate events by yourself and conversions that are particular to your website, such as destination URL instances earlier, or created particularly for non-standard page interactions using tools such as Google Tag manager. We can prepare the events as reports once these events get enrolled in Google analytics 4. However, the channels, campaigns, locations, and devices are the driving factors for conversions in Universal Analytics.We can focus more on the campaigns and keywords that drive most conversions using this data and diminish campaigns that are less important by consuming less time or money.Conversion metrics are seen in all Acquisition and User reports, and a conclusion of all conversions can be seen in the engagement inside conversions report.It was elementary to create a goal funnel report in Universal Analytics. It was explicitly handy for reporting on people moving through an ecommerce checkout. It didn’t use to report so effectively on the tinier interactions across your website. However, the behavior flow registers attempted to display the pages people visited and dropped off as they moved through your website; it didn’t essentially link up with the goals you were recording.Although the Funnel or path exploration reports in GA4, it will display pages and paths to conversion that create events and page interactions into account. They are not just visits to a web page, but what people do on those web pages.It is worth establishing these reports to map your user and customer journey and touchpoints through your website and mobile app but if you are beginning with Google analytics g4, then leave these reports for the moment until you get to know the other reports described above.
Multi-Channel Funnel Reports
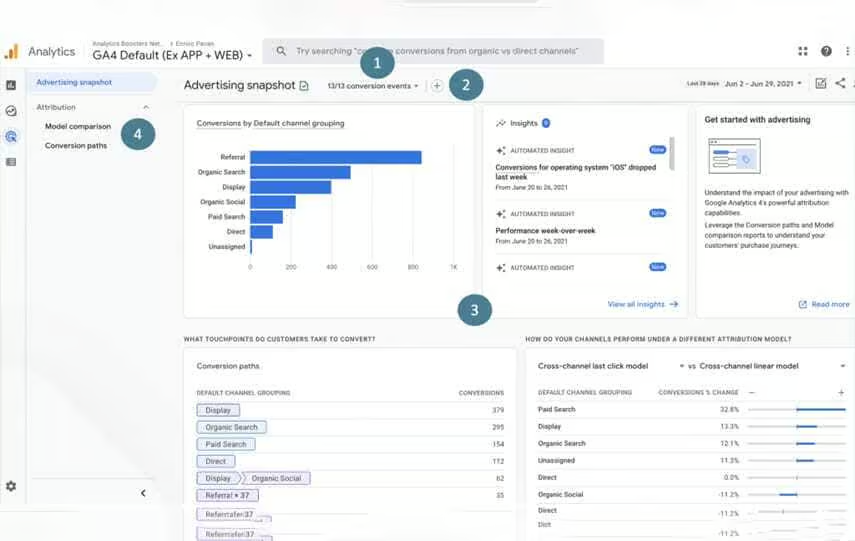
One of the latest versions of Universal Analytics was its ability to view the different touchpoints that lead to goal attainment or ecommerce transaction.This functionality is also accessible in Google Analytics 4 and can be seen in the Advertise Section of the left-hand menu. You can see your conversion paths which display the different channel journeys that move the conversion on your website.
Source: Online metrics
However, the reporting engine is widely different from Universal Analytics and GA 4; much of the reporting functionality is obtainable in Google Analytics 4. It is just named a little bit differently, or the navigation is through the overview segment rather than straightly through the left-hand navigation.
Comparisons, Filters, and Segments
As you get to know about the reporting with GA4, there might come times when you need to focus more on specific data points.In Universal Analytics, you might add a filter at the property or a view level or a custom segment to put an interim filter over the data with the intentions of comparison. It is also possible to strain traffic at the property level, though alternatives are limited compared to Universal Analytics.You can also use a contemporary filter similar to the custom segment in Universal Analytics simply by pressing the comparison button at the top segment of the report, then defining the conditions for data you want to aim on. It would be best if you got GA4 set up quickly to run simultaneously with UA, and now is an apt time to familiarize yourself and your team with how reports work in Google Analytics 4.
How to Read Analysis Hub Reports
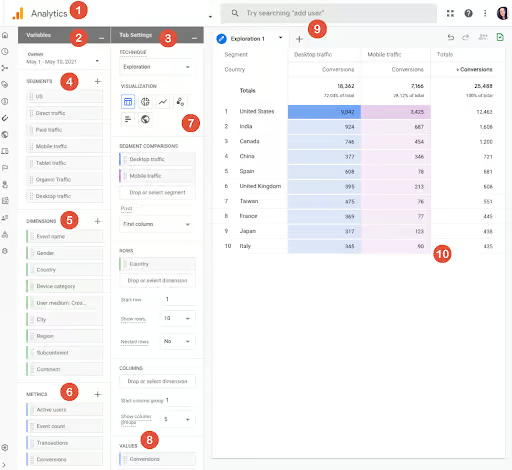
Source: Search engine journal
1.Go to the analysis hub
2.Variables column
The variables column is where you will find and select the data you want to utilize in your analysis, such as Date Range, segments, dimensions, metrics
3.Tab settings column
The tab settings column is where you will make clear the analysis technique, add dimensions and metrics and apply segments.
4.Segments
Segments are distinct groups of users. Drag and drop various groups of users into your report to compare and contrast how they are making a pattern. If you don’t view the segment you want to use, you can add your own by clicking on the plus icon.
5.Dimensions
Dimensions are the elements that you are supposed to analyze. For instance, event count, active users, transactions and so on. You can drag and drop dimensions as rows and columns in the Tab setting area.
6.Metrics
Metrics assign the numbers in your analysis. You can add more metrics to the Values area in the Tab settings.
7.Visualization
You can choose the design of the report. You will be provided with exploration options that include table, pie chart, line graph, and more.
8.Values
Drag the metrics that you want to project as columns in the report. Moreover, the cell type can also be displayed as a bar chart, plain text or heat map.
9.Tabs
Tabs project your visualizations. An analysis can include up to 10 tabs. To create a new tab, click the plus icon
10.Display
You can interact with the stored data by right-clicking a data point in the visualization.
Categories of Analysis
Exploration
GA4 exploration offers more control over the data visualization than was previously available in Universal Analytics. There are various configuration options within exploration to assist you in uncovering new insights and represent your data in a way that makes sense to customers and the team. Anomaly detection is one of the best features of Google Analytics 4 since it automatically flags any data points that are outside of what the desired outcome was.
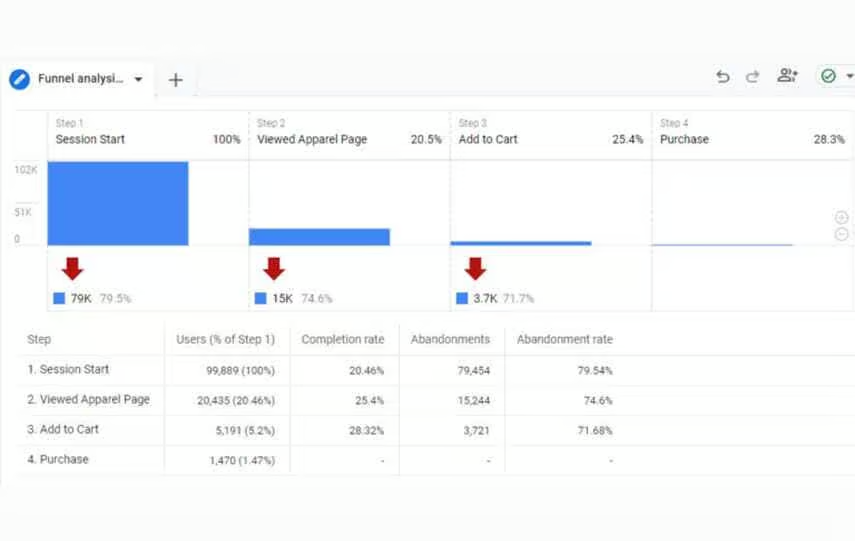
Funnel Analysis
If you want to know how web visitors become one-time shoppers and then how do one time become repeat customers, then you can find it out in Google Analytics 4 funnel analysis report. You can visualize the steps that shoppers take to finish an event and see how well they are doing or failing at each step.
Path Analysis
If you liked the behavior pattern of flow reports in UA, you would also love analysis hub pathing reports in Google Analysis 4.Path analysis envisages the event stream which is known as a tree graph. An event stream is a sequence of events users trigger along their path.The path analysis technique aids marketers to unfold looping behavior which may signal users getting stuck.
Segment Overlap
Segments can be utilized in both Universal Analytics and Google Analytics 4 features.In GA4, segments can be utilized as user events or sessions. Marketers can even develop segments, including multiple conditions, and arrange those into a condition group.Consider a segment as a specific group of our site users. For instance, a segment might be users from a particular day, those who visited a particular page, or users who took a specific job, such as purchasing from a particular product type.
Cohort Analysis
A cohort is a group of users with common traits, such as a similar acquisition date, event, or conversion.For instance, you can develop a cohort report to view how far it takes people to convert in relation to a particular marketing technique.
Conclusion
The analytic tools are one of your most potent marketing arms. They assist you in building an understanding of web traffic and how users behave once they access your website.It is a relatively simple fundamental that your better analytics insights will lead to better marketing decisions.
Google Analytics 4 is the analytics update that the digital market was awaiting. It offers marketers more flexibility and a means to forecast user behavior without messing with user privacy. GA4 is not far from becoming the topmost preference for any seo agency.
Once you pass the learning curve, you will find the flexibility and enhanced insights most handy and valuable.
Visit our blog page to find more content related to SEO, and if you want enhanced website tracking and better SEO to improve your revenue, reach out, and we will get back to you ASAP.


